# 1. Prometheus监控系统
# 2. Prometheus简介
## 2.1 什么是Prometheus?
Prometheus是由前 Google 工程师从 2012 年开始在 Soundcloud以开源软件的形式进行研发的系统监控和告警工具包,自此以后,许多公司和组织都采用了 Prometheus 作为监控告警工具。Prometheus 的开发者和用户社区非常活跃,它现在是一个独立的开源项目,可以独立于任何公司进行维护。为了证明这一点,Prometheus 于 2016 年 5 月加入CNCF基金会,成为继 Kubernetes 之后的第二个 CNCF 托管项目。
## 2.2 Prometheus的优势
Prometheus 的主要优势有:
- 由指标名称和和键/值对标签标识的时间序列数据组成的多维数据模型
- 强大的查询语言 PromQL
- 不依赖分布式存储;单个服务节点具有自治能力。
- 时间序列数据是服务端通过 HTTP 协议主动拉取获得的。
- 也可以通过中间网关来推送时间序列数据
- 可以通过静态配置文件或服务发现来获取监控目标。
- 支持多种类型的图表和仪表盘。
## 2.3 Prometheus的组件、架构
Prometheus 的整体架构以及生态系统组件如下图所示:
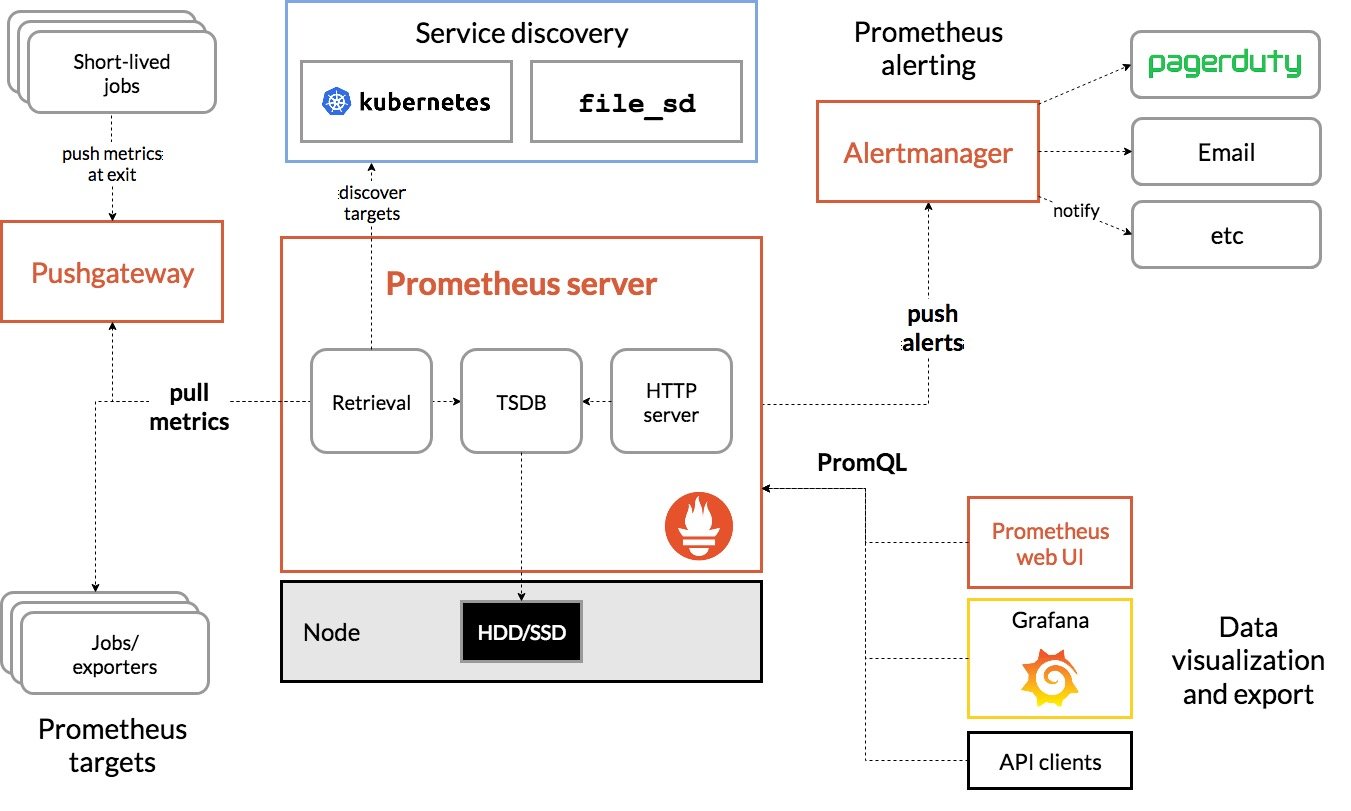
Prometheus Server 直接从监控目标中或者间接通过推送网关来拉取监控指标,它在本地存储所有抓取到的样本数据,并对此数据执行一系列规则,以汇总和记录现有数据的新时间序列或生成告警。可以通过 Grafana或者其他工具来实现监控数据的可视化。
- **Prometheus server**是Prometheus架构中的**核心组件**,基于go语言编写而成,无第三方依赖关系,可以独立部署在物理服务器上、云主机、Docker容器内。主要用于收集每个目标数据,并存储为时间序列数据,对外可提供数据查询支持和告警规则配置管理。
- Prometheus服务器可以对监控目标进行静态配置管理或者动态配置管理,**它将监控采集到的数据按照时间序列存储在本地磁盘的时序数据库中**(当然也支持远程存储),自身对外提供了自定义的PromQL语言,可以对数据进行查询和分析
- Client Library是用于检测应用程序代码的客户端库。在监控服务之前,需要向客户端库代码添加检测实现Prometheus中metric的类型。
- **Exporter**(数据采集)用于**输出被监控组件信息的HTTP**接口统称为Exporter(导出器)。目前互联网公司常用的组件大部分都有Expoter供**直接使用**,比如Nginx、MySQL、linux系统信息等。
- **Pushgateway**是指用于支持短期临时或批量计划任务工作的汇聚节点。主要用于短期的job,此类存在的job时间较短,可能在Prometheus来pull之前就自动消失了。所以针对这类job,设计成可以直接向Pushgateway推送metric,这样Prometheus服务器端便可以定时去Pushgateway拉去metric
- Pushgateway是prometheus的一个组件,prometheus server默认是通过exporter主动获取数据(默认采取pull拉取数据),pushgateway则是通过被动方式推送数据到prometheus server,用户可以写一些自定义的监控脚本把需要监控的数据发送给pushgateway, 然后pushgateway再把数据发送给Prometheus server
- 总结就是pushgateway是prometheus的一个组件,是通过被动的方式将数据上传至prometheus。这个可以解决不在一个网段的问题
- **Alertmanager**主要用于处理Prometheus服务器端发送的alerts信息,对其去除重数据、分组并路由到正确的接收方式,发出**告警**,支持丰富的告警方式。
- **Service Discovery:**动态发现待监控的target,从而完成监控配置的重要组件,在容器环境中尤为重要,该组件目前由Prometheus Server内建支持
参考博客:https://zhuanlan.zhihu.com/p/710612579
## 2.4 Prometheus适用于什么场景
Prometheus适用于记录**文本格式的时间序列**,它既适用于以机器为中心的监控,也适用于高度动态的面向服务的监控,在微服务的世界中,它对多维数据收集和查询的支持有特殊优势。Prometheus是专为提高系统可靠性而设计的,它可以在断电期间快速诊断问题,每个Prometheus Server都是相互独立的,不依赖于网络存储或者其他远程服务。当基础架构出现问题时,你可以通过Prometheus快速定位故障点,而且不会消耗大量的基础架构资源。
## 2.5 Prometheus不适合什么场景
Prometheus非常重视可靠性,即使在出现故障的情况下,你也可以随时统计有关系统的可用系统信息。如果你需要百分之百的准确度,例如按请求数量计费,那么Prometheus可能不太适合你,因为它收集的数据可能**不够详细完整精确**。
# 3. Prometheus部署
## 3.1 二进制部署
1. 下载prometheus的二进制包
官网地址:https://prometheus.io/download/
```bash
[root@server1 ~]# wget https://github.com/prometheus/prometheus/releases/download/v2.47.0/prometheus-2.47.0.linux-amd64.tar.gz
```
2. 获取软件包的哈希值,与官网提供的软件包的哈希值进行对比,保证下载的Prometheus软件包的完整性
```bash
[root@server1 ~]# sha256sum prometheus-2.47.0.linux-amd64.tar.gz
277ad9f110ded8e326bc885848952941e839fa38dd3237e36415f0fa35a04424 prometheus-2.47.0.linux-amd64.tar.gz
```
3. 解压软件包到指定目录
```bash
[root@server1 ~]# mkdir /data
[root@server1 ~]# tar -zxvf prometheus-2.47.0.linux-amd64.tar.gz -C /data/
[root@server1 ~]# cd /data/
[root@server1 data]# chown -R root:root /data/prometheus-2.47.0.linux-amd64
[root@server1 data]# ln -sv prometheus-2.47.0.linux-amd64 prometheus
"prometheus" -> "prometheus-2.47.0.linux-amd64"
```
### 3.1.1 前台启动
1. 启动Prometheus,会输出如下信息,此时当终端关闭或者按下ctrl + c服务会自动关闭
```bash
[root@server1 data]# cd /data/prometheus
[root@server1 prometheus]# ./prometheus
level=info ts=2021-02-28T06:03:36.885Z caller=main.go:366 msg="No time or size retention was set so using the default time retention" duration=15d
level=info ts=2021-02-28T06:03:36.885Z caller=main.go:404 msg="Starting Prometheus" version="(version=2.47.0, branch=HEAD, revision=a6be548dbc17780d562a39c0e4bd0bd4c00ad6e2)"
level=info ts=2021-02-28T06:03:36.885Z caller=main.go:409 build_context="(go=go1.15.8, user=root@615f028225c9, date=20210217-14:17:24)"
level=info ts=2021-02-28T06:03:36.885Z caller=main.go:410 host_details="(Linux 3.10.0-693.el7.x86_64 #1 SMP Tue Aug 22 21:09:27 UTC 2017 x86_64 server1 (none))"
level=info ts=2021-02-28T06:03:36.885Z caller=main.go:411 fd_limits="(soft=1024, hard=4096)"
level=info ts=2021-02-28T06:03:36.885Z caller=main.go:412 vm_limits="(soft=unlimited, hard=unlimited)"
level=info ts=2021-02-28T06:03:36.891Z caller=web.go:532 component=web msg="Start listening for connections" address=0.0.0.0:9090
level=info ts=2021-02-28T06:03:36.895Z caller=main.go:779 msg="Starting TSDB ..."
level=info ts=2021-02-28T06:03:36.897Z caller=tls_config.go:191 component=web msg="TLS is disabled." http2=false
level=info ts=2021-02-28T06:03:36.930Z caller=head.go:668 component=tsdb msg="Replaying on-disk memory mappable chunks if any"
level=info ts=2021-02-28T06:03:36.930Z caller=head.go:682 component=tsdb msg="On-disk memory mappable chunks replay completed" duration=5.69µs
level=info ts=2021-02-28T06:03:36.930Z caller=head.go:688 component=tsdb msg="Replaying WAL, this may take a while"
level=info ts=2021-02-28T06:03:36.933Z caller=head.go:740 component=tsdb msg="WAL segment loaded" segment=0 maxSegment=0
level=info ts=2021-02-28T06:03:36.933Z caller=head.go:745 component=tsdb msg="WAL replay completed" checkpoint_replay_duration=38.416µs wal_replay_duration=2.357106ms total_replay_duration=2.638813ms
level=info ts=2021-02-28T06:03:36.934Z caller=main.go:799 fs_type=XFS_SUPER_MAGIC
level=info ts=2021-02-28T06:03:36.934Z caller=main.go:802 msg="TSDB started"
level=info ts=2021-02-28T06:03:36.934Z caller=main.go:928 msg="Loading configuration file" filename=prometheus.yml
```
2. 新开一个窗口,检查端口号以及关闭防火墙和selinux
```bash
[root@server1 prometheus]# systemctl stop firewalld
[root@server1 prometheus]# setenforce 0
[root@server1 prometheus~]# ss -nlt
State Recv-Q Send-Q Local Address:Port Peer Address:Port
LISTEN 0 128 *:22 *:*
LISTEN 0 100 127.0.0.1:25 *:*
LISTEN 0 128 :::22 :::*
LISTEN 0 100 ::1:25 :::*
LISTEN 0 128 :::9090 :::*
```
### 3.1.2 检查配置文件
在Prometheus日常维护中,一定会对配置文件prometheus.yml进行再编辑操作,通常对Prometheus服务进行重新启动操作即可完成对配置文件的加载。当然也可以通过动态的热加载来更新prometheus.yml中的配置信息
查看进程id,向进程发送SIHHUP信号
```bash
# kill -HUP pid
```
通过HTTP API发送post请求到/-/reload
```bash
# curl -X POST http://localhost:9090/-/reload
```
- 检查配置文件的语法正确性
```bash
[root@server1 ~]# cd /data/prometheus
[root@server1 prometheus]# ls
console_libraries consoles data LICENSE NOTICE prometheus prometheus.yml promtool
[root@server1 prometheus]# ./promtool check config prometheus.yml
Checking prometheus.yml
SUCCESS: 0 rule files found
```
### 3.1.3 创建自启动脚本
```bash
[root@server1 ~]# vim /usr/lib/systemd/system/prometheus.service
[Unit]
Description=Prometheus Server
Documentation=https://prometheus.io/docs/introduction/overview/
After=network.target
[Service]
Type=simple
Restart=on-failure
ExecStart=/data/prometheus/prometheus \
--config.file=/data/prometheus/prometheus.yml \
--storage.tsdb.path=/data/prometheus/data \
--web.listen-address=:9090 \
--web.enable-lifecycle
ExecReload=/bin/kill -HUP $MAINPID
[Install]
WantedBy=multi-user.target
```
systemd重载配置以及启动prometheus
```bash
[root@server1 ~]# systemctl daemon-reload
[root@server1 ~]# systemctl start prometheus
[root@server1 prometheus]# ss -nlt
State Recv-Q Send-Q Local Address:Port Peer Address:Port
LISTEN 0 128 *:22 *:*
LISTEN 0 100 127.0.0.1:25 *:*
LISTEN 0 128 :::22 :::*
LISTEN 0 100 ::1:25 :::*
LISTEN 0 128 :::9090 :::*
```
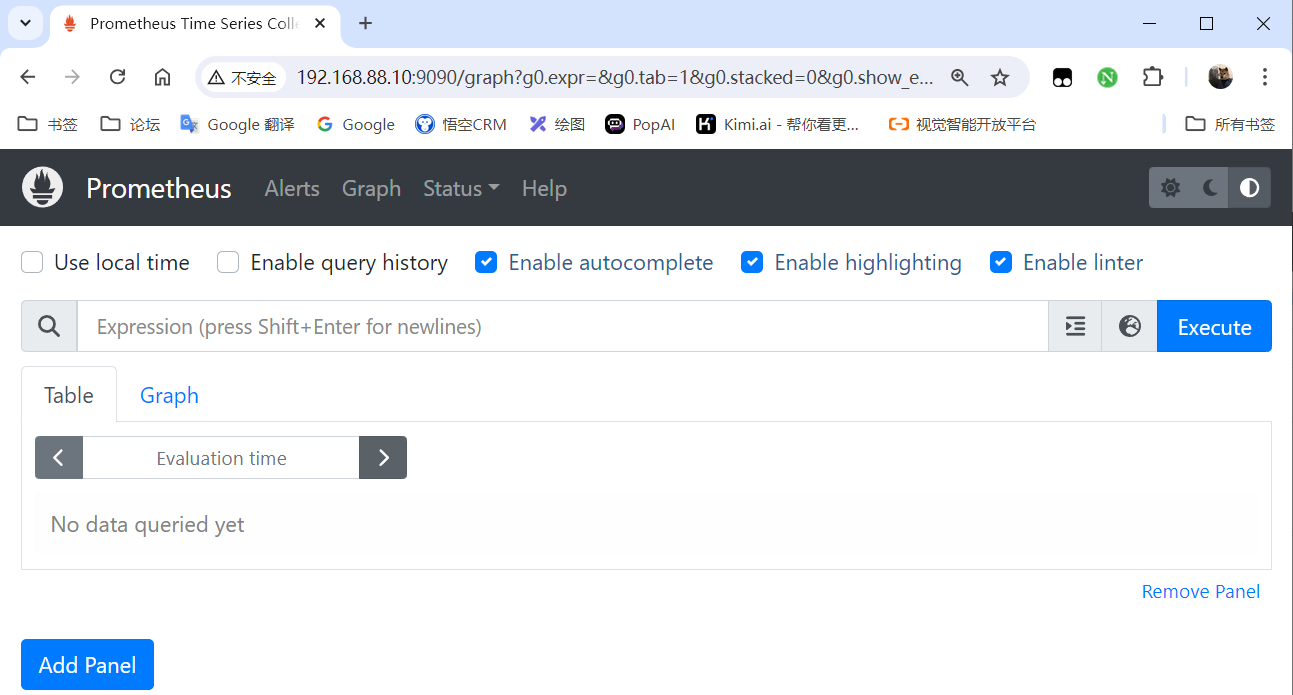
### 3.1.4 浏览器访问测试
 # 4. Exporter
## 4.1 简介
在Prometheus的核心组件中,Exporter是重要的组成部分,在实际中**监控样本数据的收集**都是由Exporter完成的,Prometheus服务器只需要定时从这些Exporter提供的HTTP服务获取数据即可。官方提供了多种常用的Exporter,比如用于对数据库监控的mysqld_exporter和redis_exporter等。
Exporter本质上是将收集的数据转化为对应的文本格式,并提供HTTP接口,供Prometheus定期采集数据。
## 4.2 Exporter类型
- 直接采集型
- 这类Exporter直接内置了响应的应用程序,用于向Prometheus直接提供target数据支持。这样设计的好处是,可以更好地监控各自系统内部的运行状态,同时也适合更多自定义监控指标的项目实施。
- 间接采集型
- 原始监控目标并不直接支持Prometheus,需要我们使用Prometheus提供的客户端库编写该监控目标的监控采集数据,用户可以将该程序独立运行,取获取指定的各类监控数据值。例如,由于Linux操作系统自身并不能直接支持Prometheus,用户无法从操作系统层面上直接提供对Prometheus的支持,因此单独提供Node Exporter,还有数据库或网站HTTP应用类等Exporter。
## 4.3 文本数据格式
在Prometheus的监控环境中,所有返回监控样本数据的Exporter程序,均需要遵守Prometheus规范,即基于文本的数据格式,其特点是具有更好的跨平台和可读性。
- 可以使用浏览器,或者通过curl工具来获得采集数据
```bash
# 以HELP开头的行,表示metric的帮助与说明解释,可以包含当前监控指标名称和对应的说明信息
# 以TYPE开始的行,表示定义metric的类型
# 以非#开头的行即监控样本的数据,包括metric_name{label_name1,label_name2...} value [timestamp可选项]
[root@server1 ~]# curl 192.168.88.10:9090/metrics
# HELP go_gc_duration_seconds A summary of the pause duration of garbage collection cycles.
# TYPE go_gc_duration_seconds summary
go_gc_duration_seconds{quantile="0"} 9.4601e-05
go_gc_duration_seconds{quantile="0.25"} 0.000141153
go_gc_duration_seconds{quantile="0.5"} 0.000416738
go_gc_duration_seconds{quantile="0.75"} 0.001050261
go_gc_duration_seconds{quantile="1"} 0.008308442
go_gc_duration_seconds_sum 0.014675204
go_gc_duration_seconds_count 13
# HELP go_goroutines Number of goroutines that currently exist.
# TYPE go_goroutines gauge
go_goroutines 32
# HELP go_info Information about the Go environment.
# TYPE go_info gauge
go_info{version="go1.15.8"} 1
# HELP go_memstats_alloc_bytes Number of bytes allocated and still in use.
# TYPE go_memstats_alloc_bytes gauge
go_memstats_alloc_bytes 1.6849432e+07
# HELP go_memstats_alloc_bytes_total Total number of bytes allocated, even if freed.
# TYPE go_memstats_alloc_bytes_total counter
go_memstats_alloc_bytes_total 6.016028e+07
# HELP go_memstats_buck_hash_sys_bytes Number of bytes used by the profiling bucket hash table.
# TYPE go_memstats_buck_hash_sys_bytes gauge
go_memstats_buck_hash_sys_bytes 1.461736e+06
# HELP go_memstats_frees_total Total number of frees.
# TYPE go_memstats_frees_total counter
go_memstats_frees_total 219435
# HELP go_memstats_gc_cpu_fraction The fraction of this program's available CPU time used by the GC since the program started.
# TYPE go_memstats_gc_cpu_fraction gauge
go_memstats_gc_cpu_fraction 3.012333999853177e-05
# HELP go_memstats_gc_sys_bytes Number of bytes used for garbage collection system metadata.
# TYPE go_memstats_gc_sys_bytes gauge
go_memstats_gc_sys_bytes 5.719272e+06
```
## 4.4 Linux主机监控
Prometheus社区很活跃,提供了非常多类型的Exporter。可以在官网中找到自己想要的Exporter并进行下载https://prometheus.io/download/
由于Linux操作系统自身并不支持Prometheus,所以Prometheus官方提供了go语言编写的Node Exporter来实现对Linux操作系统主机的监控数据采集。它提供了系统内部几乎所有的标准指标,如cpu、内存、磁盘空间、磁盘I/O、系统负载和网络带宽。另外它还提供了由内核公开的大量额外监控指标,从负载平均到主板温度等。
### 4.4.1 安装Exporter
1. 下载node exporter的二进制包并解压
```bash
[root@server2 ~]# wget https://github.com/prometheus/node_exporter/releases/download/v1.8.2/node_exporter-1.8.2.linux-amd64.tar.gz
[root@server2 ~]# mkdir /data
[root@server2 ~]# tar -zxvf node_exporter-1.8.2.linux-amd64.tar.gz -C /data/
node_exporter-1.8.2.linux-amd64/
node_exporter-1.8.2.linux-amd64/NOTICE
node_exporter-1.8.2.linux-amd64/node_exporter
node_exporter-1.8.2.linux-amd64/LICENSE
[root@server2 ~]# cd /data/
[root@server2 data]# chown -R root:root node_exporter-1.8.2.linux-amd64/
[root@server2 data]# ln -sv node_exporter-1.8.2.linux-amd64 node_exporter
"node_exporter" -> "node_exporter-1.8.2.linux-amd64"
```
2. 启动node_exporter
```bash
[root@server2 node_exporter]# ./node_exporter
```
### 4.4.2 关联Prometheus server
当启动node_exporter开始工作时,node_exporter和Prometheus server还没有进行关联,二者各自独立没有关联。
可以在Prometheus server中,找到主机目录,找到主配置文件,使用其中的静态配置功能static_configs来采集node_exporter提供的数据
**server主配置文件介绍:**
```bash
[root@server1 prometheus]# cat prometheus.yml
# my global config
global:
scrape_interval: 15s # Set the scrape interval to every 15 seconds. Default is every 1 minut e.
evaluation_interval: 15s # Evaluate rules every 15 seconds. The default is every 1 minute.
# scrape_timeout is set to the global default (10s).
# Alertmanager configuration
alerting:
alertmanagers:
- static_configs:
- targets:
# - alertmanager:9093
# Load rules once and periodically evaluate them according to the global 'evaluation_interval' .
rule_files:
# - "first_rules.yml"
# - "second_rules.yml"
# A scrape configuration containing exactly one endpoint to scrape:
# Here it's Prometheus itself.
scrape_configs:
# The job name is added as a label `job=` to any timeseries scraped from this conf ig.
- job_name: "prometheus"
# metrics_path defaults to '/metrics'
# scheme defaults to 'http'.
static_configs:
- targets: ["localhost:9090"]
==================================================================================
# 配置文件解释
global:
scrape_interval:每次数据采集的时间间隔,默认为1分钟
scrape_timeout:采集请求超时时间,默认为10秒
evaluation_interval:执行rules的频率,默认为1分钟
scrape_configs:主要用于配置被采集数据节点操作,每一个采集配置主要由以下几个参数
job_name:全局唯一名称
scrape_interval:默认等于global内设置的参数,设置后可以覆盖global中的值
scrape_timeout:默认等于global内设置的参数
metrics_path:从targets获取meitric的HTTP资源路径,默认是/metrics
honor_labels:Prometheus如何处理标签之间的冲突。若设置为True,则通过保留变迁来解决冲突;若设置为false,则通过重命名;
scheme:用于请求的协议方式,默认是http
params:数据采集访问时HTTP URL设定的参数
relabel_configs:采集数据重置标签配置
metric_relabel_configs:重置标签配置
sample_limit:对每个被已知样本数量的每次采集进行限制,如果超过限制,该数据将被视为失败。默认值为0,表示无限制
```
- 直接编辑主配置文件,添加job与node_exporter关联
```bash
scrape_configs:
# The job name is added as a label `job=` to any timeseries scraped from this config.
- job_name: "prometheus"
# metrics_path defaults to '/metrics'
# scheme defaults to 'http'.
static_configs:
- targets: ["localhost:9090"]
- job_name: "node_exporter"
static_configs:
- targets: ["192.168.88.20:9100"]
```
- 检查配置文件并且重启服务
```bash
[root@server1 prometheus]# ./promtool check config prometheus.yml
Checking prometheus.yml
SUCCESS: prometheus.yml is valid prometheus config file syntax
[root@server1 prometheus]# systemctl restart prometheus
[root@server1 prometheus]# ss -nlt
State Recv-Q Send-Q Local Address:Port Peer Address:Port
LISTEN 0 128 *:22 *:*
LISTEN 0 100 127.0.0.1:25 *:*
LISTEN 0 128 :::22 :::*
LISTEN 0 100 ::1:25 :::*
LISTEN 0 128 :::9090 :::*
```
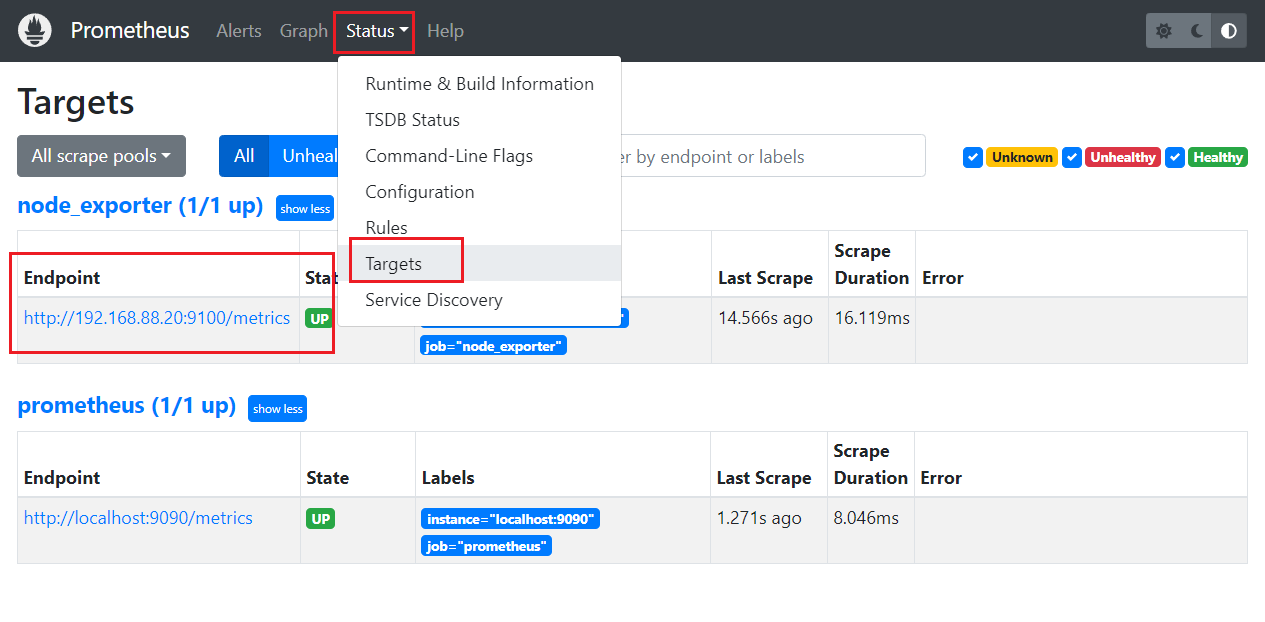
### 4.4.3 查看Targets
重启服务即可成功关联
# 4. Exporter
## 4.1 简介
在Prometheus的核心组件中,Exporter是重要的组成部分,在实际中**监控样本数据的收集**都是由Exporter完成的,Prometheus服务器只需要定时从这些Exporter提供的HTTP服务获取数据即可。官方提供了多种常用的Exporter,比如用于对数据库监控的mysqld_exporter和redis_exporter等。
Exporter本质上是将收集的数据转化为对应的文本格式,并提供HTTP接口,供Prometheus定期采集数据。
## 4.2 Exporter类型
- 直接采集型
- 这类Exporter直接内置了响应的应用程序,用于向Prometheus直接提供target数据支持。这样设计的好处是,可以更好地监控各自系统内部的运行状态,同时也适合更多自定义监控指标的项目实施。
- 间接采集型
- 原始监控目标并不直接支持Prometheus,需要我们使用Prometheus提供的客户端库编写该监控目标的监控采集数据,用户可以将该程序独立运行,取获取指定的各类监控数据值。例如,由于Linux操作系统自身并不能直接支持Prometheus,用户无法从操作系统层面上直接提供对Prometheus的支持,因此单独提供Node Exporter,还有数据库或网站HTTP应用类等Exporter。
## 4.3 文本数据格式
在Prometheus的监控环境中,所有返回监控样本数据的Exporter程序,均需要遵守Prometheus规范,即基于文本的数据格式,其特点是具有更好的跨平台和可读性。
- 可以使用浏览器,或者通过curl工具来获得采集数据
```bash
# 以HELP开头的行,表示metric的帮助与说明解释,可以包含当前监控指标名称和对应的说明信息
# 以TYPE开始的行,表示定义metric的类型
# 以非#开头的行即监控样本的数据,包括metric_name{label_name1,label_name2...} value [timestamp可选项]
[root@server1 ~]# curl 192.168.88.10:9090/metrics
# HELP go_gc_duration_seconds A summary of the pause duration of garbage collection cycles.
# TYPE go_gc_duration_seconds summary
go_gc_duration_seconds{quantile="0"} 9.4601e-05
go_gc_duration_seconds{quantile="0.25"} 0.000141153
go_gc_duration_seconds{quantile="0.5"} 0.000416738
go_gc_duration_seconds{quantile="0.75"} 0.001050261
go_gc_duration_seconds{quantile="1"} 0.008308442
go_gc_duration_seconds_sum 0.014675204
go_gc_duration_seconds_count 13
# HELP go_goroutines Number of goroutines that currently exist.
# TYPE go_goroutines gauge
go_goroutines 32
# HELP go_info Information about the Go environment.
# TYPE go_info gauge
go_info{version="go1.15.8"} 1
# HELP go_memstats_alloc_bytes Number of bytes allocated and still in use.
# TYPE go_memstats_alloc_bytes gauge
go_memstats_alloc_bytes 1.6849432e+07
# HELP go_memstats_alloc_bytes_total Total number of bytes allocated, even if freed.
# TYPE go_memstats_alloc_bytes_total counter
go_memstats_alloc_bytes_total 6.016028e+07
# HELP go_memstats_buck_hash_sys_bytes Number of bytes used by the profiling bucket hash table.
# TYPE go_memstats_buck_hash_sys_bytes gauge
go_memstats_buck_hash_sys_bytes 1.461736e+06
# HELP go_memstats_frees_total Total number of frees.
# TYPE go_memstats_frees_total counter
go_memstats_frees_total 219435
# HELP go_memstats_gc_cpu_fraction The fraction of this program's available CPU time used by the GC since the program started.
# TYPE go_memstats_gc_cpu_fraction gauge
go_memstats_gc_cpu_fraction 3.012333999853177e-05
# HELP go_memstats_gc_sys_bytes Number of bytes used for garbage collection system metadata.
# TYPE go_memstats_gc_sys_bytes gauge
go_memstats_gc_sys_bytes 5.719272e+06
```
## 4.4 Linux主机监控
Prometheus社区很活跃,提供了非常多类型的Exporter。可以在官网中找到自己想要的Exporter并进行下载https://prometheus.io/download/
由于Linux操作系统自身并不支持Prometheus,所以Prometheus官方提供了go语言编写的Node Exporter来实现对Linux操作系统主机的监控数据采集。它提供了系统内部几乎所有的标准指标,如cpu、内存、磁盘空间、磁盘I/O、系统负载和网络带宽。另外它还提供了由内核公开的大量额外监控指标,从负载平均到主板温度等。
### 4.4.1 安装Exporter
1. 下载node exporter的二进制包并解压
```bash
[root@server2 ~]# wget https://github.com/prometheus/node_exporter/releases/download/v1.8.2/node_exporter-1.8.2.linux-amd64.tar.gz
[root@server2 ~]# mkdir /data
[root@server2 ~]# tar -zxvf node_exporter-1.8.2.linux-amd64.tar.gz -C /data/
node_exporter-1.8.2.linux-amd64/
node_exporter-1.8.2.linux-amd64/NOTICE
node_exporter-1.8.2.linux-amd64/node_exporter
node_exporter-1.8.2.linux-amd64/LICENSE
[root@server2 ~]# cd /data/
[root@server2 data]# chown -R root:root node_exporter-1.8.2.linux-amd64/
[root@server2 data]# ln -sv node_exporter-1.8.2.linux-amd64 node_exporter
"node_exporter" -> "node_exporter-1.8.2.linux-amd64"
```
2. 启动node_exporter
```bash
[root@server2 node_exporter]# ./node_exporter
```
### 4.4.2 关联Prometheus server
当启动node_exporter开始工作时,node_exporter和Prometheus server还没有进行关联,二者各自独立没有关联。
可以在Prometheus server中,找到主机目录,找到主配置文件,使用其中的静态配置功能static_configs来采集node_exporter提供的数据
**server主配置文件介绍:**
```bash
[root@server1 prometheus]# cat prometheus.yml
# my global config
global:
scrape_interval: 15s # Set the scrape interval to every 15 seconds. Default is every 1 minut e.
evaluation_interval: 15s # Evaluate rules every 15 seconds. The default is every 1 minute.
# scrape_timeout is set to the global default (10s).
# Alertmanager configuration
alerting:
alertmanagers:
- static_configs:
- targets:
# - alertmanager:9093
# Load rules once and periodically evaluate them according to the global 'evaluation_interval' .
rule_files:
# - "first_rules.yml"
# - "second_rules.yml"
# A scrape configuration containing exactly one endpoint to scrape:
# Here it's Prometheus itself.
scrape_configs:
# The job name is added as a label `job=` to any timeseries scraped from this conf ig.
- job_name: "prometheus"
# metrics_path defaults to '/metrics'
# scheme defaults to 'http'.
static_configs:
- targets: ["localhost:9090"]
==================================================================================
# 配置文件解释
global:
scrape_interval:每次数据采集的时间间隔,默认为1分钟
scrape_timeout:采集请求超时时间,默认为10秒
evaluation_interval:执行rules的频率,默认为1分钟
scrape_configs:主要用于配置被采集数据节点操作,每一个采集配置主要由以下几个参数
job_name:全局唯一名称
scrape_interval:默认等于global内设置的参数,设置后可以覆盖global中的值
scrape_timeout:默认等于global内设置的参数
metrics_path:从targets获取meitric的HTTP资源路径,默认是/metrics
honor_labels:Prometheus如何处理标签之间的冲突。若设置为True,则通过保留变迁来解决冲突;若设置为false,则通过重命名;
scheme:用于请求的协议方式,默认是http
params:数据采集访问时HTTP URL设定的参数
relabel_configs:采集数据重置标签配置
metric_relabel_configs:重置标签配置
sample_limit:对每个被已知样本数量的每次采集进行限制,如果超过限制,该数据将被视为失败。默认值为0,表示无限制
```
- 直接编辑主配置文件,添加job与node_exporter关联
```bash
scrape_configs:
# The job name is added as a label `job=` to any timeseries scraped from this config.
- job_name: "prometheus"
# metrics_path defaults to '/metrics'
# scheme defaults to 'http'.
static_configs:
- targets: ["localhost:9090"]
- job_name: "node_exporter"
static_configs:
- targets: ["192.168.88.20:9100"]
```
- 检查配置文件并且重启服务
```bash
[root@server1 prometheus]# ./promtool check config prometheus.yml
Checking prometheus.yml
SUCCESS: prometheus.yml is valid prometheus config file syntax
[root@server1 prometheus]# systemctl restart prometheus
[root@server1 prometheus]# ss -nlt
State Recv-Q Send-Q Local Address:Port Peer Address:Port
LISTEN 0 128 *:22 *:*
LISTEN 0 100 127.0.0.1:25 *:*
LISTEN 0 128 :::22 :::*
LISTEN 0 100 ::1:25 :::*
LISTEN 0 128 :::9090 :::*
```
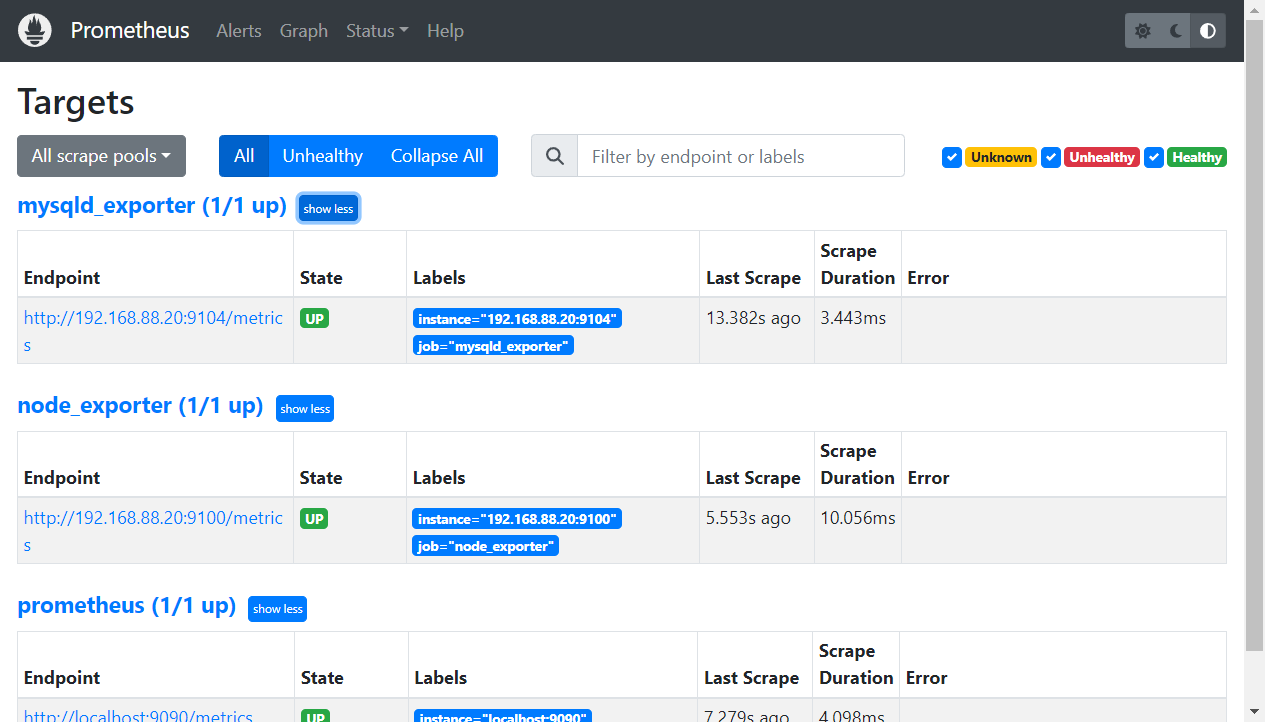
### 4.4.3 查看Targets
重启服务即可成功关联
 ### 4.4.4 metricts数据采集
`node_exporter` 是 Prometheus 生态系统中的一个重要组件,用于收集主机级别的系统指标(如 CPU、内存、磁盘、网络等)。以下是 `node_exporter` 常见的监控项及其含义
#### 4.4.4.1 常见采集项
1. **CPU 相关指标**
- `node_cpu_seconds_total`:CPU 在每个模式(user、system、idle 等)下的使用时间(秒)。
- 模式包括:`user`(用户态)、`system`(内核态)、`idle`(空闲)、`iowait`(等待 I/O)等。
- **`node_cpu_cores`**:CPU 核心数。
- **`node_cpu_frequency_hertz`**:CPU 频率。
------
2. **内存相关指标**
- **`node_memory_MemTotal_bytes`**:系统总内存大小。
- **`node_memory_MemFree_bytes`**:空闲内存大小。
- **`node_memory_Buffers_bytes`**:缓冲区使用的内存大小。
- **`node_memory_Cached_bytes`**:缓存使用的内存大小。
- **`node_memory_SwapTotal_bytes`**:交换分区总大小。
- **`node_memory_SwapFree_bytes`**:空闲交换分区大小。
------
3. **磁盘相关指标**
- **`node_disk_read_bytes_total`**:磁盘读取的总字节数。
- **`node_disk_written_bytes_total`**:磁盘写入的总字节数。
- **`node_disk_reads_completed_total`**:完成的磁盘读取操作数。
- **`node_disk_writes_completed_total`**:完成的磁盘写入操作数。
- **`node_disk_io_time_seconds_total`**:磁盘 I/O 操作的总时间。
- **`node_filesystem_size_bytes`**:文件系统总大小。
- **`node_filesystem_free_bytes`**:文件系统空闲大小。
------
4. **网络相关指标**
- **`node_network_receive_bytes_total`**:网络接口接收的总字节数。
- **`node_network_transmit_bytes_total`**:网络接口发送的总字节数。
- **`node_network_receive_packets_total`**:网络接口接收的数据包总数。
- **`node_network_transmit_packets_total`**:网络接口发送的数据包总数。
------
5. **系统负载相关指标**
- **`node_load1`**:1 分钟内的系统平均负载。
- **`node_load5`**:5 分钟内的系统平均负载。
- **`node_load15`**:15 分钟内的系统平均负载。
------
6. **进程相关指标**
- **`node_procs_running`**:当前正在运行的进程数。
- **`node_procs_blocked`**:当前被阻塞的进程数。
------
7. **文件描述符相关指标**
- **`node_filefd_allocated`**:已分配的文件描述符数量。
- **`node_filefd_maximum`**:文件描述符的最大数量。
------
8. **时间相关指标**
- **`node_time_seconds`**:当前系统时间(Unix 时间戳)。
- **`node_boot_time_seconds`**:系统启动时间(Unix 时间戳)。
------
9. **其他指标**
- **`node_uname_info`**:系统信息(如内核版本、操作系统等)。
- **`node_os_info`**:操作系统信息。
#### 4.4.4.2 示例
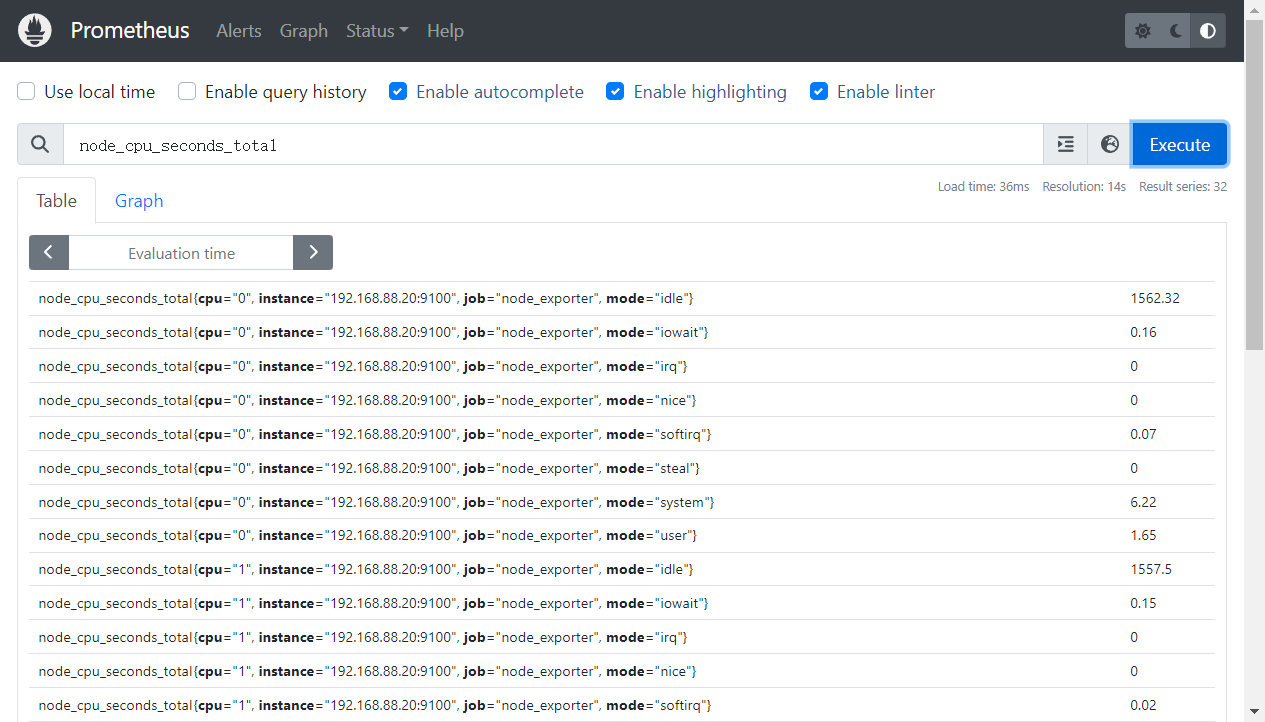
一、CPU 在每个模式(user、system、idle 等)下的使用时间(秒)
node_cpu_seconds_total
### 4.4.4 metricts数据采集
`node_exporter` 是 Prometheus 生态系统中的一个重要组件,用于收集主机级别的系统指标(如 CPU、内存、磁盘、网络等)。以下是 `node_exporter` 常见的监控项及其含义
#### 4.4.4.1 常见采集项
1. **CPU 相关指标**
- `node_cpu_seconds_total`:CPU 在每个模式(user、system、idle 等)下的使用时间(秒)。
- 模式包括:`user`(用户态)、`system`(内核态)、`idle`(空闲)、`iowait`(等待 I/O)等。
- **`node_cpu_cores`**:CPU 核心数。
- **`node_cpu_frequency_hertz`**:CPU 频率。
------
2. **内存相关指标**
- **`node_memory_MemTotal_bytes`**:系统总内存大小。
- **`node_memory_MemFree_bytes`**:空闲内存大小。
- **`node_memory_Buffers_bytes`**:缓冲区使用的内存大小。
- **`node_memory_Cached_bytes`**:缓存使用的内存大小。
- **`node_memory_SwapTotal_bytes`**:交换分区总大小。
- **`node_memory_SwapFree_bytes`**:空闲交换分区大小。
------
3. **磁盘相关指标**
- **`node_disk_read_bytes_total`**:磁盘读取的总字节数。
- **`node_disk_written_bytes_total`**:磁盘写入的总字节数。
- **`node_disk_reads_completed_total`**:完成的磁盘读取操作数。
- **`node_disk_writes_completed_total`**:完成的磁盘写入操作数。
- **`node_disk_io_time_seconds_total`**:磁盘 I/O 操作的总时间。
- **`node_filesystem_size_bytes`**:文件系统总大小。
- **`node_filesystem_free_bytes`**:文件系统空闲大小。
------
4. **网络相关指标**
- **`node_network_receive_bytes_total`**:网络接口接收的总字节数。
- **`node_network_transmit_bytes_total`**:网络接口发送的总字节数。
- **`node_network_receive_packets_total`**:网络接口接收的数据包总数。
- **`node_network_transmit_packets_total`**:网络接口发送的数据包总数。
------
5. **系统负载相关指标**
- **`node_load1`**:1 分钟内的系统平均负载。
- **`node_load5`**:5 分钟内的系统平均负载。
- **`node_load15`**:15 分钟内的系统平均负载。
------
6. **进程相关指标**
- **`node_procs_running`**:当前正在运行的进程数。
- **`node_procs_blocked`**:当前被阻塞的进程数。
------
7. **文件描述符相关指标**
- **`node_filefd_allocated`**:已分配的文件描述符数量。
- **`node_filefd_maximum`**:文件描述符的最大数量。
------
8. **时间相关指标**
- **`node_time_seconds`**:当前系统时间(Unix 时间戳)。
- **`node_boot_time_seconds`**:系统启动时间(Unix 时间戳)。
------
9. **其他指标**
- **`node_uname_info`**:系统信息(如内核版本、操作系统等)。
- **`node_os_info`**:操作系统信息。
#### 4.4.4.2 示例
一、CPU 在每个模式(user、system、idle 等)下的使用时间(秒)
node_cpu_seconds_total
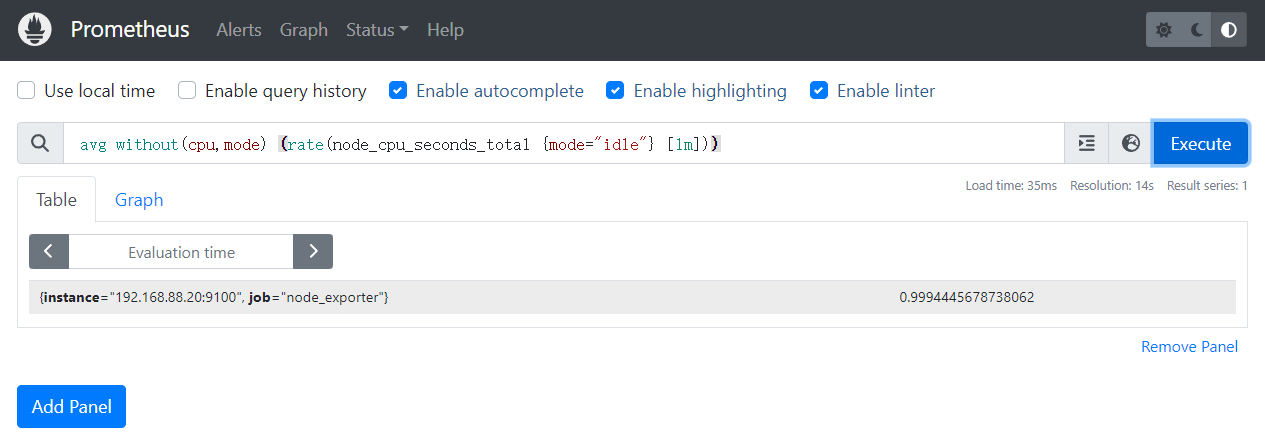
 可以通过PromQL(后面会介绍这种查询语言)表达式进行查询,计算每核cpu每秒的空闲时间,然后对主机上的所有cpu求平均值
`avg without(cpu,mode) (rate(node_cpu_seconds_total {mode="idle"} [1m]))`
可以通过PromQL(后面会介绍这种查询语言)表达式进行查询,计算每核cpu每秒的空闲时间,然后对主机上的所有cpu求平均值
`avg without(cpu,mode) (rate(node_cpu_seconds_total {mode="idle"} [1m]))`
 二、内存信息采集
当前主机内存查看
```bash
[root@server2 node_exporter]# free -b
total used free shared buff/cache available
Mem: 1907970048 112123904 1564102656 10014720 231743488 1609289728
Swap: 2147479552 0 2147479552
```
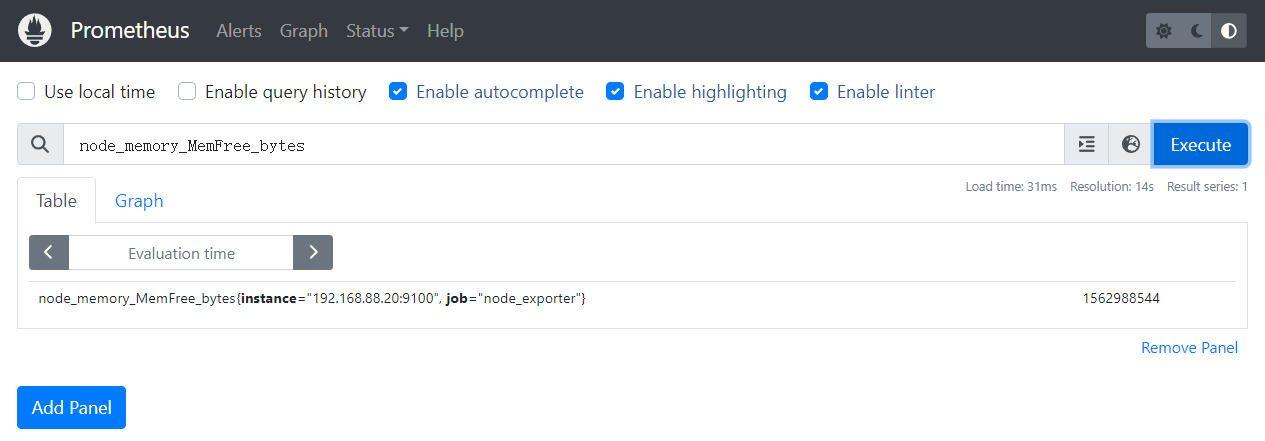
总内存:node_memory_MemTotal_bytes
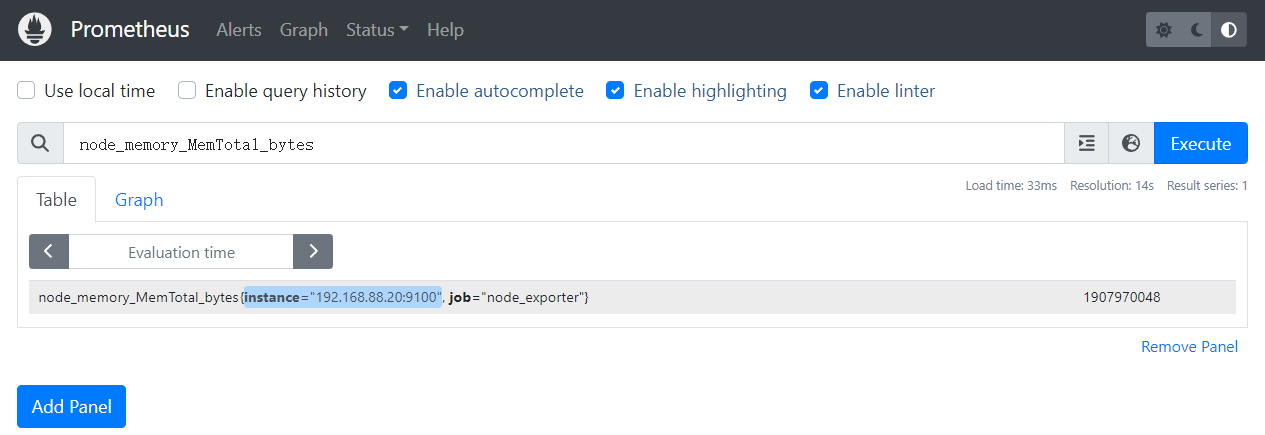
空闲内存:node_memory_MemFree_bytes
二、内存信息采集
当前主机内存查看
```bash
[root@server2 node_exporter]# free -b
total used free shared buff/cache available
Mem: 1907970048 112123904 1564102656 10014720 231743488 1609289728
Swap: 2147479552 0 2147479552
```
总内存:node_memory_MemTotal_bytes

空闲内存:node_memory_MemFree_bytes
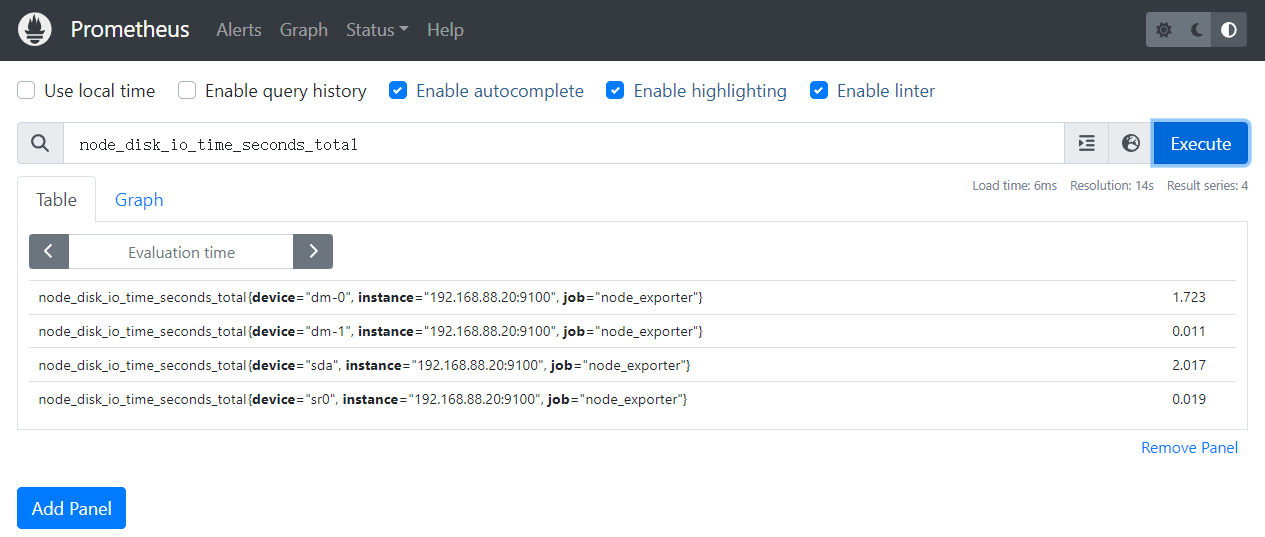
 三、磁盘信息采集
磁盘 I/O 操作的总时间:node_disk_io_time_seconds_total
三、磁盘信息采集
磁盘 I/O 操作的总时间:node_disk_io_time_seconds_total
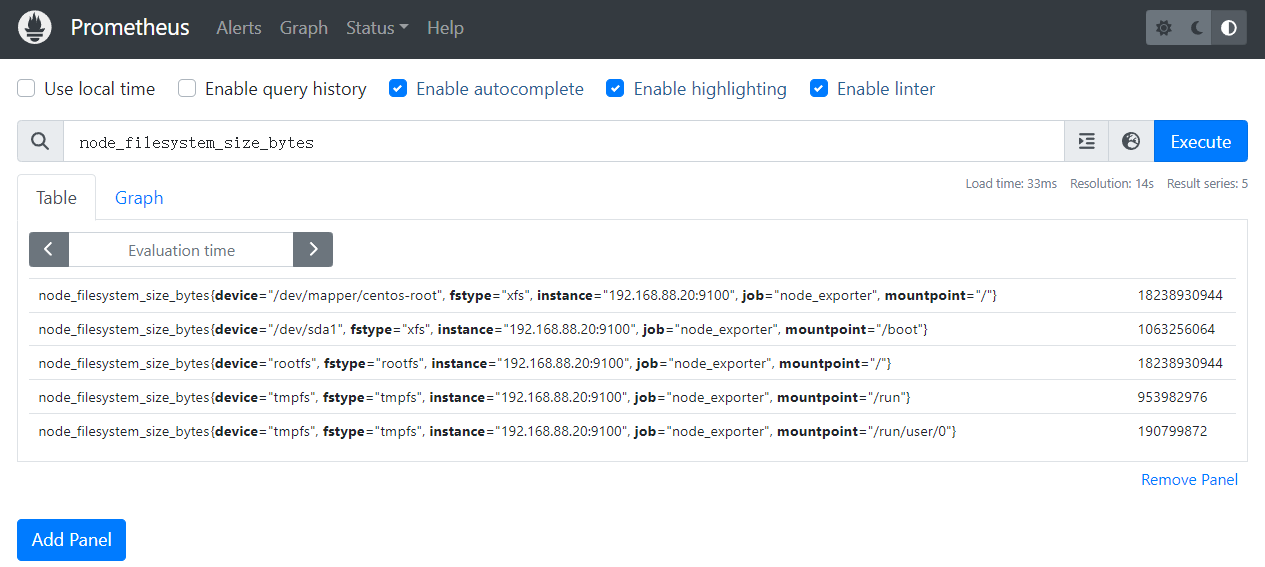
 四、文件系统采集
node_filesystem_size_bytes
四、文件系统采集
node_filesystem_size_bytes
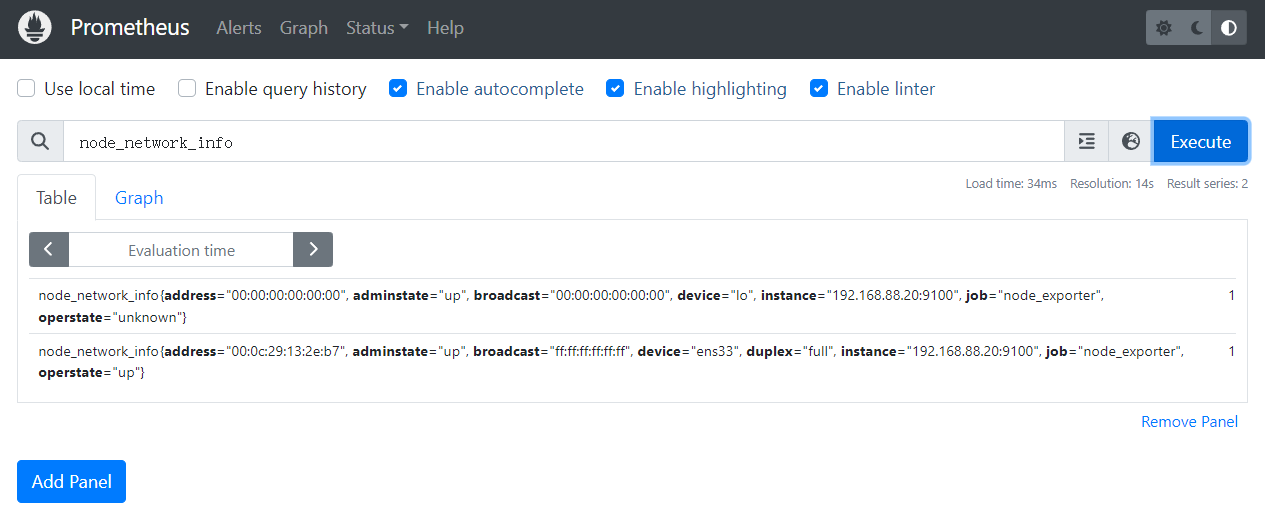
 五、网络信息采集
node_network_info
五、网络信息采集
node_network_info
 任意一个Exporter都会提供足够多的metric,我们在学习的时候也不需要关心具体有多少metric,每个metric具体意思(其实见名知义大概也可以猜到)
## 4.5 MySQL监控
### 4.5.1 部署MySQL环境
```bash
[root@server2 ~]# yum install -y mariadb-server
# 启动mariadb数据库
[root@server2 ~]# systemctl enable --now mariadb
# 初始化数据库并设置密码
[root@server2 ~]# mysqladmin -uroot password '123456'
# 测试数据库连接是否正常
[root@server2 ~]# mysql -uroot -p123456 -e "show databases;"
+--------------------+
| Database |
+--------------------+
| information_schema |
| mysql |
| performance_schema |
| test |
+--------------------+
# 创建exporter用户
ariaDB [(none)]> grant all privileges on *.* to mysqld_exporter@'localhost' identified by '123456';
Query OK, 0 rows affected (0.00 sec)
# 刷新账户信息
MariaDB [(none)]> flush privileges;
Query OK, 0 rows affected (0.00 sec)
```
### 4.5.2 安装Exporter
官网下载mysqld_exporter二进制包解压缩
```bash
[root@server2 ~]# wget https://github.com/prometheus/mysqld_exporter/releases/download/v0.15.1/mysqld_exporter-0.15.1.linux-amd64.tar.gz
[root@server2 ~]# tar -zxvf mysqld_exporter-0.15.1.linux-amd64.tar.gz -C /data/
mysqld_exporter-0.15.1.linux-amd64/
mysqld_exporter-0.15.1.linux-amd64/LICENSE
mysqld_exporter-0.15.1.linux-amd64/mysqld_exporter
mysqld_exporter-0.15.1.linux-amd64/NOTICE
[root@server2 ~]# cd /data/
[root@server2 data]# chown -R root:root mysqld_exporter-0.15.1.linux-amd64/
[root@server2 data]# ln -sv mysqld_exporter-0.15.1.linux-amd64/ mysqld_exporter
"mysqld_exporter" -> "mysqld_exporter-0.15.1.linux-amd64/"
```
### 4.5.3 配置Exporter
```bash
[root@server2 mysqld_exporter]# pwd
/data/mysqld_exporter
# 创建一个配置文件.mysqld_exporter.cnf
[root@server2 mysqld_exporter]# vim .mysqld_exporter.cnf
[client]
user=mysqld_exporter
password=123456
[root@server2 mysqld_exporter]# ./mysqld_exporter --config.my-cnf='.mysqld_exporter.cnf' &
[root@server2 mysqld_exporter]# ss -nlt
State Recv-Q Send-Q Local Address:Port Peer Address:Port
LISTEN 0 50 *:3306 *:*
LISTEN 0 128 *:22 *:*
LISTEN 0 100 127.0.0.1:25 *:*
LISTEN 0 128 :::9100 :::*
LISTEN 0 128 :::9104 :::*
LISTEN 0 128 :::22 :::*
LISTEN 0 100 ::1:25 :::*
```
### 4.5.4 关联Prometheus server
```bash
[root@server1 prometheus]# vim prometheus.yml
- job_name: 'mysqld_exporter'
scrape_interval: 10s
static_configs:
- targets: [192.168.88.20:9104]
[root@server1 prometheus]# ./promtool check config prometheus.yml
Checking prometheus.yml
SUCCESS: prometheus.yml is valid prometheus config file syntax
[root@server1 prometheus]# systemctl restart prometheus
```
任意一个Exporter都会提供足够多的metric,我们在学习的时候也不需要关心具体有多少metric,每个metric具体意思(其实见名知义大概也可以猜到)
## 4.5 MySQL监控
### 4.5.1 部署MySQL环境
```bash
[root@server2 ~]# yum install -y mariadb-server
# 启动mariadb数据库
[root@server2 ~]# systemctl enable --now mariadb
# 初始化数据库并设置密码
[root@server2 ~]# mysqladmin -uroot password '123456'
# 测试数据库连接是否正常
[root@server2 ~]# mysql -uroot -p123456 -e "show databases;"
+--------------------+
| Database |
+--------------------+
| information_schema |
| mysql |
| performance_schema |
| test |
+--------------------+
# 创建exporter用户
ariaDB [(none)]> grant all privileges on *.* to mysqld_exporter@'localhost' identified by '123456';
Query OK, 0 rows affected (0.00 sec)
# 刷新账户信息
MariaDB [(none)]> flush privileges;
Query OK, 0 rows affected (0.00 sec)
```
### 4.5.2 安装Exporter
官网下载mysqld_exporter二进制包解压缩
```bash
[root@server2 ~]# wget https://github.com/prometheus/mysqld_exporter/releases/download/v0.15.1/mysqld_exporter-0.15.1.linux-amd64.tar.gz
[root@server2 ~]# tar -zxvf mysqld_exporter-0.15.1.linux-amd64.tar.gz -C /data/
mysqld_exporter-0.15.1.linux-amd64/
mysqld_exporter-0.15.1.linux-amd64/LICENSE
mysqld_exporter-0.15.1.linux-amd64/mysqld_exporter
mysqld_exporter-0.15.1.linux-amd64/NOTICE
[root@server2 ~]# cd /data/
[root@server2 data]# chown -R root:root mysqld_exporter-0.15.1.linux-amd64/
[root@server2 data]# ln -sv mysqld_exporter-0.15.1.linux-amd64/ mysqld_exporter
"mysqld_exporter" -> "mysqld_exporter-0.15.1.linux-amd64/"
```
### 4.5.3 配置Exporter
```bash
[root@server2 mysqld_exporter]# pwd
/data/mysqld_exporter
# 创建一个配置文件.mysqld_exporter.cnf
[root@server2 mysqld_exporter]# vim .mysqld_exporter.cnf
[client]
user=mysqld_exporter
password=123456
[root@server2 mysqld_exporter]# ./mysqld_exporter --config.my-cnf='.mysqld_exporter.cnf' &
[root@server2 mysqld_exporter]# ss -nlt
State Recv-Q Send-Q Local Address:Port Peer Address:Port
LISTEN 0 50 *:3306 *:*
LISTEN 0 128 *:22 *:*
LISTEN 0 100 127.0.0.1:25 *:*
LISTEN 0 128 :::9100 :::*
LISTEN 0 128 :::9104 :::*
LISTEN 0 128 :::22 :::*
LISTEN 0 100 ::1:25 :::*
```
### 4.5.4 关联Prometheus server
```bash
[root@server1 prometheus]# vim prometheus.yml
- job_name: 'mysqld_exporter'
scrape_interval: 10s
static_configs:
- targets: [192.168.88.20:9104]
[root@server1 prometheus]# ./promtool check config prometheus.yml
Checking prometheus.yml
SUCCESS: prometheus.yml is valid prometheus config file syntax
[root@server1 prometheus]# systemctl restart prometheus
```
 ### 4.5.5 metricts数据采集
MySQL数据库的性能状态监控内容非常多,但通常必不可少的内容包括查询吞吐量、查询执行性能、连接情况、缓冲池使用情况等。
#### 4.5.5.1 常见采集项
1. **MySQL状态信息**:
- `mysql_global_status_connections`: 当前连接数。
- `mysql_global_status_threads_connected`: 当前连接的线程数。
- `mysql_global_status_threads_running`: 当前正在运行的线程数。
----
2. **查询性能**:
- `mysql_global_status_questions`: 服务器启动以来执行的查询总数。
- `mysql_global_status_slow_queries`: 慢查询的数量。
----
3. **连接和线程**:
- `mysql_global_status_max_used_connections`: 服务器启动以来同时使用的最大连接数。
- `mysql_global_status_aborted_connects`: 失败的连接尝试次数。
----
4. **InnoDB存储引擎**:
- `mysql_global_status_innodb_buffer_pool_read_requests`: InnoDB缓冲池的读请求次数。
- `mysql_global_status_innodb_buffer_pool_reads`: 从磁盘读取的次数。
- `mysql_global_status_innodb_buffer_pool_pages_free`: InnoDB缓冲池中空闲的页数。
- `mysql_global_status_innodb_row_lock_waits`: InnoDB行锁等待的次数。
----
5. **网络流量**:
- `mysql_global_status_bytes_received`: 从所有客户端接收的字节数。
- `mysql_global_status_bytes_sent`: 发送到所有客户端的字节数。
----
6. **表缓存**:
- `mysql_global_status_table_open_cache_hits`: 表缓存命中次数。
- `mysql_global_status_table_open_cache_misses`: 表缓存未命中次数。
----
7. **复制状态**(如果启用了复制):
- `mysql_slave_status_slave_io_running`: 从库I/O线程是否正在运行。
- `mysql_slave_status_slave_sql_running`: 从库SQL线程是否正在运行。
- `mysql_slave_status_seconds_behind_master`: 从库落后主库的秒数。
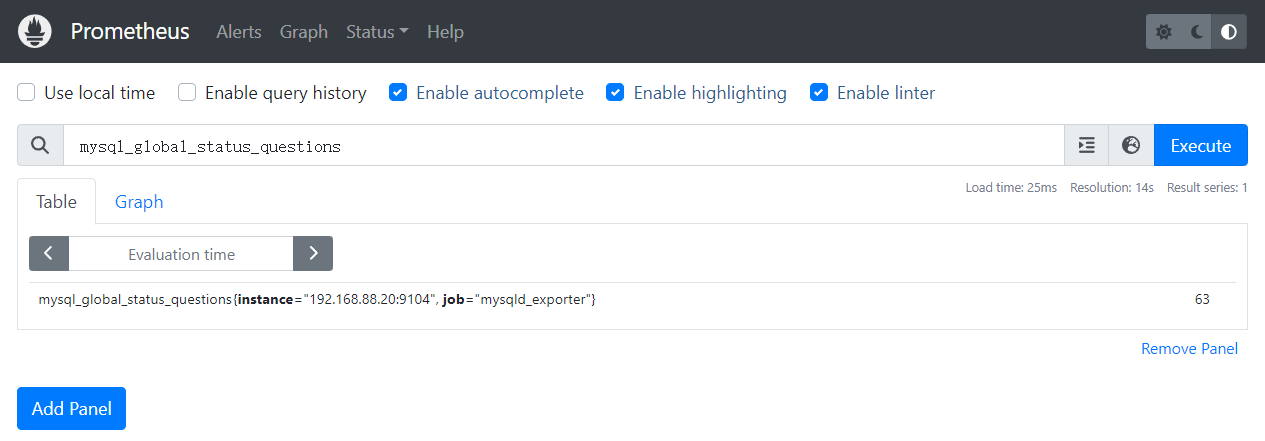
#### 4.5.5.2 示例
一、查询吞吐量,MySQL客户端应用程序发送的所有查询语句,该计数器都是递增的
mysql_global_status_questions
### 4.5.5 metricts数据采集
MySQL数据库的性能状态监控内容非常多,但通常必不可少的内容包括查询吞吐量、查询执行性能、连接情况、缓冲池使用情况等。
#### 4.5.5.1 常见采集项
1. **MySQL状态信息**:
- `mysql_global_status_connections`: 当前连接数。
- `mysql_global_status_threads_connected`: 当前连接的线程数。
- `mysql_global_status_threads_running`: 当前正在运行的线程数。
----
2. **查询性能**:
- `mysql_global_status_questions`: 服务器启动以来执行的查询总数。
- `mysql_global_status_slow_queries`: 慢查询的数量。
----
3. **连接和线程**:
- `mysql_global_status_max_used_connections`: 服务器启动以来同时使用的最大连接数。
- `mysql_global_status_aborted_connects`: 失败的连接尝试次数。
----
4. **InnoDB存储引擎**:
- `mysql_global_status_innodb_buffer_pool_read_requests`: InnoDB缓冲池的读请求次数。
- `mysql_global_status_innodb_buffer_pool_reads`: 从磁盘读取的次数。
- `mysql_global_status_innodb_buffer_pool_pages_free`: InnoDB缓冲池中空闲的页数。
- `mysql_global_status_innodb_row_lock_waits`: InnoDB行锁等待的次数。
----
5. **网络流量**:
- `mysql_global_status_bytes_received`: 从所有客户端接收的字节数。
- `mysql_global_status_bytes_sent`: 发送到所有客户端的字节数。
----
6. **表缓存**:
- `mysql_global_status_table_open_cache_hits`: 表缓存命中次数。
- `mysql_global_status_table_open_cache_misses`: 表缓存未命中次数。
----
7. **复制状态**(如果启用了复制):
- `mysql_slave_status_slave_io_running`: 从库I/O线程是否正在运行。
- `mysql_slave_status_slave_sql_running`: 从库SQL线程是否正在运行。
- `mysql_slave_status_seconds_behind_master`: 从库落后主库的秒数。
#### 4.5.5.2 示例
一、查询吞吐量,MySQL客户端应用程序发送的所有查询语句,该计数器都是递增的
mysql_global_status_questions
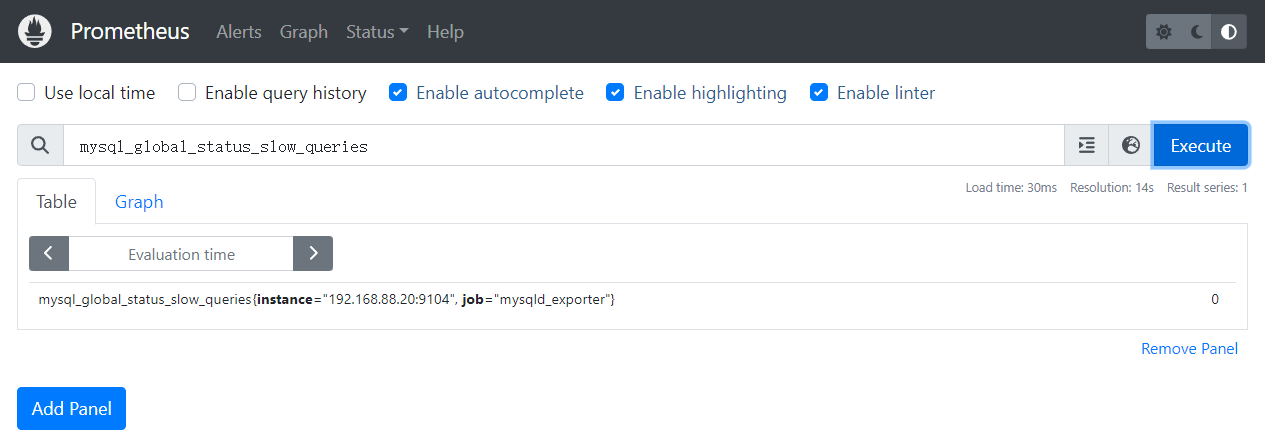
 二、查询执行性能,每当查询时间超过预先设定的慢查询时间计数器都会递增
mysql_global_status_slow_queries
二、查询执行性能,每当查询时间超过预先设定的慢查询时间计数器都会递增
mysql_global_status_slow_queries
 三、连接情况,查询MySQL所设置的最大连接数,防止连接数量过大导致服务器过载运行
mysql_global_variables_max_connections
三、连接情况,查询MySQL所设置的最大连接数,防止连接数量过大导致服务器过载运行
mysql_global_variables_max_connections
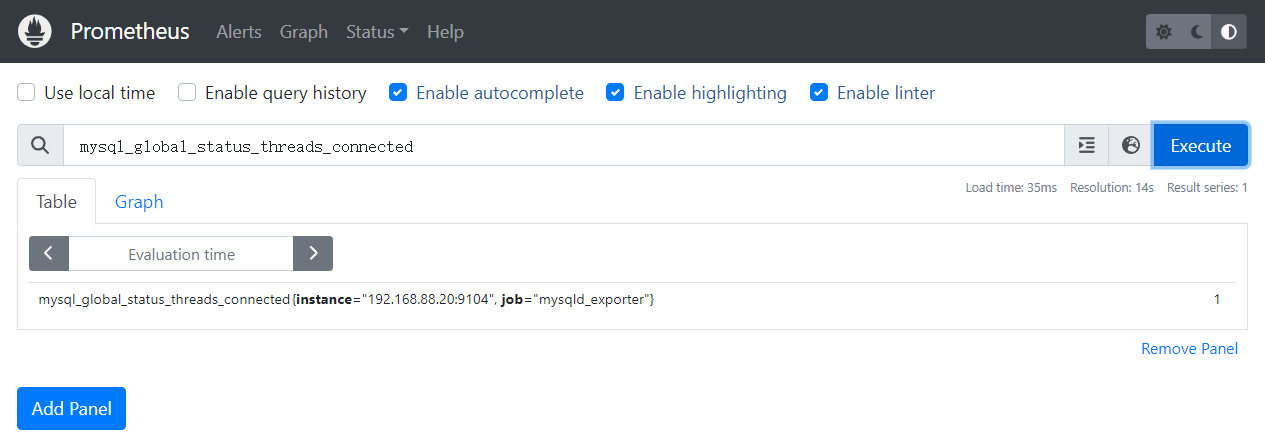
 四、查看当前连接数
mysql_global_status_threads_connected
四、查看当前连接数
mysql_global_status_threads_connected
 五、缓存池使用情况
mysql_global_status_innodb_buffer_pool_bytes_data4
五、缓存池使用情况
mysql_global_status_innodb_buffer_pool_bytes_data4
 Prometheus大多数情况下,显示的默认单位为字节,必要时候,可以自己进行单位换算
mysql_global_status_innodb_buffer_pool_bytes_data/1024/1024
存储单位通常以 **1024** 为基数进行换算(二进制方式),但在某些场景下也可能以 **1000** 为基数(十进制方式)。以下是常见的存储单位及其换算关系:
| 单位 | 缩写 | 换算关系(二进制) | 换算关系(十进制) |
| :----- | :--- | :------------------------------- | :------------------------------- |
| 字节 | B | 1 B = 8 bit | 1 B = 8 bit |
| 千字节 | KB | 1 KB = 1024 B | 1 KB = 1000 B |
| 兆字节 | MB | 1 MB = 1024 KB = 1,048,576 B | 1 MB = 1000 KB = 1,000,000 B |
| 吉字节 | GB | 1 GB = 1024 MB = 1,073,741,824 B | 1 GB = 1000 MB = 1,000,000,000 B |
| 太字节 | TB | 1 TB = 1024 GB | 1 TB = 1000 GB |
| 拍字节 | PB | 1 PB = 1024 TB | 1 PB = 1000 TB |
| 艾字节 | EB | 1 EB = 1024 PB | 1 EB = 1000 PB |
| 泽字节 | ZB | 1 ZB = 1024 EB | 1 ZB = 1000 EB |
| 尧字节 | YB | 1 YB = 1024 ZB | 1 YB = 1000 ZB |
# 5. 服务发现
Prometheus服务发现能够自动化检测分类,并且能够识别新目标和变更目标。也就是说,可以自动发现并监控目标或变更目标,动态进行数据采集和处理。
## 5.1 基于文件的服务发现
- 准备JSON格式的文件
```bash
[root@server1 ~]# cd /data/prometheus
[root@server1 prometheus]# mkdir targets
[root@server1 prometheus]# vim targets/dev_node.json
[{
"targets": [ "192.168.88.20:9100","192.168.88.20:9104" ],
"labels": {
"env": "dev_webgame"
}
}]
-------------------------------------------------------------------
或者这里是准备yaml文件,那么下面相应的配置文件需要与yaml匹配
vim targets/dev_node.yml
- targets:
- "192.168.88.20:9100"
- "192.168.88.20:9104"
```
- 修改配置文件
```bash
[root@server1 prometheus]# vim /data/prometheus/prometheus.yml
- job_name: 'node_service_discovery'
file_sd_configs:
- files:
- targets/*.yml
refresh_interval: 60s
```
- 重新启动服务
扩展:这是基于文件发现,还有基于consul基于dns的服务发现,这个自行扩展。
# 6. 相关概念
## 6.1 Jobs和Instances
在Prometheus中,任何被采集的目标,即每一个暴露监控样本数据的HTTP服务都称为**一个实例instance**,**通常对应于单个进程**。而**具有相同采集目的实例集合称为作业job**。
## 6.2 数据模型
Prometheus所有采集的监控数据均以**指标的形式**保存在内置的时间序列数据库当中(TSDB):属于同一**指标名称**、同一**标签**集合的、有**时间戳**标记的数据流。除了存储的时间序列,Prometheus还可以根据查询请求产生临时的、衍生的时间序列作为返回结果。
### 6.2.1 指标名称和标签
每一条时间序列由指标名称(Metric Name)以及一组标签(键值对)唯一标识。其中指标的名称(Metric Name)可以反映被监控样本的含义(例如,http_request_total可以看出来表示当前系统接收到的http请求总量),指标名称只能由ASCII字符、数字、下划线以及冒号组成,同时必须匹配正则表达式`[a-zA-Z_:][a-zA-Z0-9_:]*`。
**注意**
冒号用来表示用户自定义的记录规则,不能在 exporter 中或监控对象直接暴露的指标中使用冒号来定义指标名称。
通过使用标签,Prometheus开启了强大的多维数据模型:对于相同的指标名称,通过不同标签列表的集合,会形成特定的度量维度实例(例如,所有包含度量名称为 `/api/tracks` 的 http 请求,打上 `method=POST` 的标签,就会形成具体的 http 请求)。查询语言在这些指标和标签列表的基础上进行过滤和聚合,改变任何度量指标上的任何标签值(包括添加或删除指标),都会创建新的时间序列。
标签的名称只能由ASCII字符、数字、以及下划线组成并满足正则表达式`[a-zA-Z_][a-zA-Z0-9_]*`。其中以 `__` 作为前缀的标签,是系统保留的关键字,只能在系统内部使用。标签的值则可以包含任何 `Unicode` 编码的字符。
### 6.2.2 样本
在时间序列中的每一个点称为样本,样本由以下三部分组成:
- 指标(metric):指标名称和描述当前样本特征的labelset;
- 时间戳:一个精确到时间毫秒的时间戳
- 样本值:一个浮点型数据表示当前样本的值
### 6.2.3 表示方式
通过如下表示方式表示指定名称和指定标签集合的时间序列
```
{
Prometheus大多数情况下,显示的默认单位为字节,必要时候,可以自己进行单位换算
mysql_global_status_innodb_buffer_pool_bytes_data/1024/1024
存储单位通常以 **1024** 为基数进行换算(二进制方式),但在某些场景下也可能以 **1000** 为基数(十进制方式)。以下是常见的存储单位及其换算关系:
| 单位 | 缩写 | 换算关系(二进制) | 换算关系(十进制) |
| :----- | :--- | :------------------------------- | :------------------------------- |
| 字节 | B | 1 B = 8 bit | 1 B = 8 bit |
| 千字节 | KB | 1 KB = 1024 B | 1 KB = 1000 B |
| 兆字节 | MB | 1 MB = 1024 KB = 1,048,576 B | 1 MB = 1000 KB = 1,000,000 B |
| 吉字节 | GB | 1 GB = 1024 MB = 1,073,741,824 B | 1 GB = 1000 MB = 1,000,000,000 B |
| 太字节 | TB | 1 TB = 1024 GB | 1 TB = 1000 GB |
| 拍字节 | PB | 1 PB = 1024 TB | 1 PB = 1000 TB |
| 艾字节 | EB | 1 EB = 1024 PB | 1 EB = 1000 PB |
| 泽字节 | ZB | 1 ZB = 1024 EB | 1 ZB = 1000 EB |
| 尧字节 | YB | 1 YB = 1024 ZB | 1 YB = 1000 ZB |
# 5. 服务发现
Prometheus服务发现能够自动化检测分类,并且能够识别新目标和变更目标。也就是说,可以自动发现并监控目标或变更目标,动态进行数据采集和处理。
## 5.1 基于文件的服务发现
- 准备JSON格式的文件
```bash
[root@server1 ~]# cd /data/prometheus
[root@server1 prometheus]# mkdir targets
[root@server1 prometheus]# vim targets/dev_node.json
[{
"targets": [ "192.168.88.20:9100","192.168.88.20:9104" ],
"labels": {
"env": "dev_webgame"
}
}]
-------------------------------------------------------------------
或者这里是准备yaml文件,那么下面相应的配置文件需要与yaml匹配
vim targets/dev_node.yml
- targets:
- "192.168.88.20:9100"
- "192.168.88.20:9104"
```
- 修改配置文件
```bash
[root@server1 prometheus]# vim /data/prometheus/prometheus.yml
- job_name: 'node_service_discovery'
file_sd_configs:
- files:
- targets/*.yml
refresh_interval: 60s
```
- 重新启动服务
扩展:这是基于文件发现,还有基于consul基于dns的服务发现,这个自行扩展。
# 6. 相关概念
## 6.1 Jobs和Instances
在Prometheus中,任何被采集的目标,即每一个暴露监控样本数据的HTTP服务都称为**一个实例instance**,**通常对应于单个进程**。而**具有相同采集目的实例集合称为作业job**。
## 6.2 数据模型
Prometheus所有采集的监控数据均以**指标的形式**保存在内置的时间序列数据库当中(TSDB):属于同一**指标名称**、同一**标签**集合的、有**时间戳**标记的数据流。除了存储的时间序列,Prometheus还可以根据查询请求产生临时的、衍生的时间序列作为返回结果。
### 6.2.1 指标名称和标签
每一条时间序列由指标名称(Metric Name)以及一组标签(键值对)唯一标识。其中指标的名称(Metric Name)可以反映被监控样本的含义(例如,http_request_total可以看出来表示当前系统接收到的http请求总量),指标名称只能由ASCII字符、数字、下划线以及冒号组成,同时必须匹配正则表达式`[a-zA-Z_:][a-zA-Z0-9_:]*`。
**注意**
冒号用来表示用户自定义的记录规则,不能在 exporter 中或监控对象直接暴露的指标中使用冒号来定义指标名称。
通过使用标签,Prometheus开启了强大的多维数据模型:对于相同的指标名称,通过不同标签列表的集合,会形成特定的度量维度实例(例如,所有包含度量名称为 `/api/tracks` 的 http 请求,打上 `method=POST` 的标签,就会形成具体的 http 请求)。查询语言在这些指标和标签列表的基础上进行过滤和聚合,改变任何度量指标上的任何标签值(包括添加或删除指标),都会创建新的时间序列。
标签的名称只能由ASCII字符、数字、以及下划线组成并满足正则表达式`[a-zA-Z_][a-zA-Z0-9_]*`。其中以 `__` 作为前缀的标签,是系统保留的关键字,只能在系统内部使用。标签的值则可以包含任何 `Unicode` 编码的字符。
### 6.2.2 样本
在时间序列中的每一个点称为样本,样本由以下三部分组成:
- 指标(metric):指标名称和描述当前样本特征的labelset;
- 时间戳:一个精确到时间毫秒的时间戳
- 样本值:一个浮点型数据表示当前样本的值
### 6.2.3 表示方式
通过如下表示方式表示指定名称和指定标签集合的时间序列
```
{